
The HTTP(S) Test Script Recorder allows JMeter to intercept and record your actions while you browse your web application with your normal browser. JMeter will create test sample objects and store them directly into your test plan as you go (so you can view samples interactively while you make them).
Yes, the quote above is clear enough, the Recording feature will help you to create quickly a test plan based on the actions which you’ve performed in your web application. Besides that, it’s also a useful feature for new users to get familiar with JMeter, rather than building a basic test plan by manually.
Note: This post is applicable from JMeter 3.0 or higher. The older version might not work properly.
The tutorial below will show you how to recording the page http://jmeter.apache.org/ on Chrome and Firefox.
Step 1: Open JMeter, click Templates… button in the buttons toolbar.
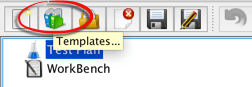
Step 2: In the Templates pop-up, select Recording in the Select Template drop-down list. And click Create button to create a Recording Test Script.

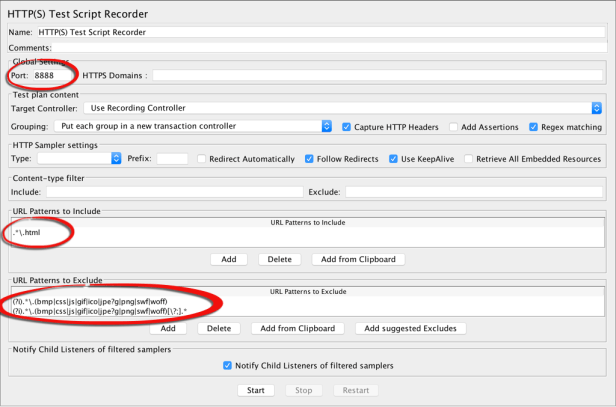
Step 3: You will see the Test Plan with the full element for a Recording Test Script. Please focus to WorkBench > HTTP(S) Test Script Recorder. We have many properties/settings in this element, but just pay attention to the following properties are enough:
- Port: Default 8888. It’s the port that the HTTP(S) Test Script Recorder listens to. You can change it. And remember that the properly port number should be: 4000 < port number < 65535. For now, just leave it 8888 as default.
- URL Patterns to Include: Allows filtering of requests that are recorded. All requests pass through, but only those that meet the requirements of the Include (using Regular Expression) fields are recorded.
- Click Add button in URL Patterns to Include
- This will create a blank entry; enter
.*\.html
NOTE: this pattern.*\.htmlmeans if the request end with.html, it will be recorded, otherwise, it will NOT be recorded. So please careful, if your site does not end with.html, then you can leave it blank. - Or you can input the pattern base on your site to record exactly what come from your site.
Example:- my site is
jmetervn.comthen I will input patternjmetervn.com.* - my site is
www. example.comthen I will inputwww. example.com.*
(please ignore the space between www. and example)
- my site is
- URL Patterns to Exclude: Any requests that match one or more Exclude pattern are NOT recorded. Usually, we don’t record all the request such as image (.png, .jpg), css, js, etc. Just leave it as default, JMeter added 2 useful regex.
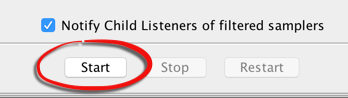
Step 4: Click Start button at bottom of page:
And then click OK in the Certificate pop-up:
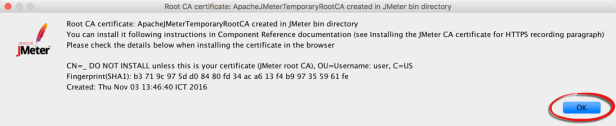
Note: this is just the pop-up for showing your information to let the proxy/server know who is using recording, it’s related to the security issue. If you’re using your own certificate, it’s ok, just click OK. And don’t forget, don’t send your certificate file to anyone else.
Step 5: Config your browser to use the JMeter Proxy
- Firefox
- Open Firefox
- Click Menu > Preference

- Go to Advance > Network > Settings…
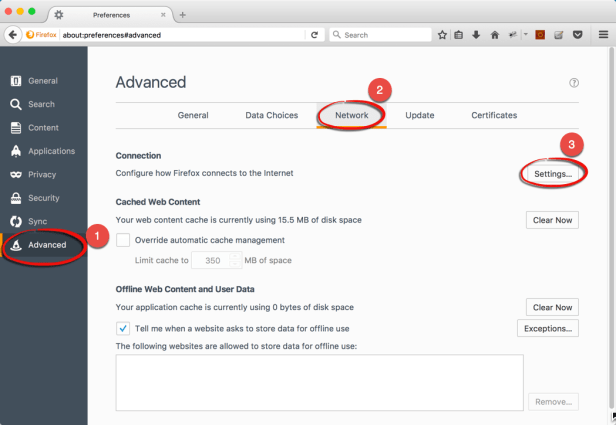
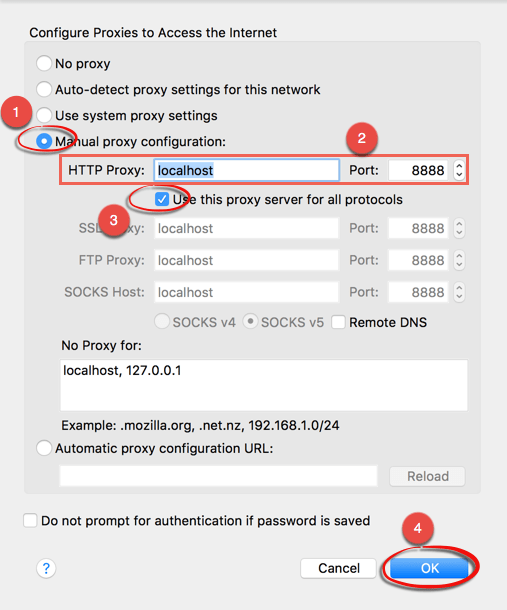
- Select Manual proxy configuration
- Input
localhostinto HTTP Proxy field - Input the Port in step 3 above into Port field. In my sample, it’s
8888 - Click OK.
- Chrome (on MAC)
- Open Chrome
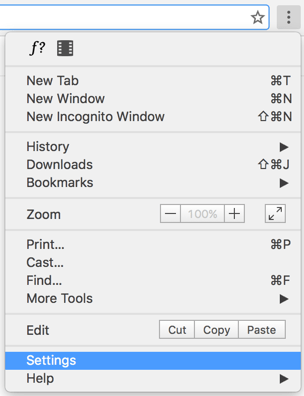
- Click Menu > Settings
- Search
proxy - Click Change proxy settings…
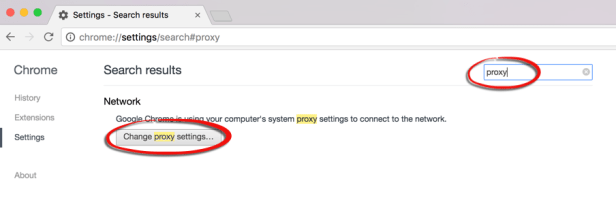
- Network pop-up is opened, select Proxies tab
- Select checkbox Web Proxy (HTTP), Secure Web Proxy (HTTPS), FTP Proxy, and SOCKS Proxy.
- Input localhost into HTTP Proxy field
- Input the Port in step 3 above into Port field. In my sample, it’s 8888
- Click OK.

- Then click Apply in Network pop-up
- Safari (on MAC)
- Open Safari
- In the menu bar, click Safari > Preference
- Select tab Advanced in the pop-up
- Click Change Settings… in Proxies field
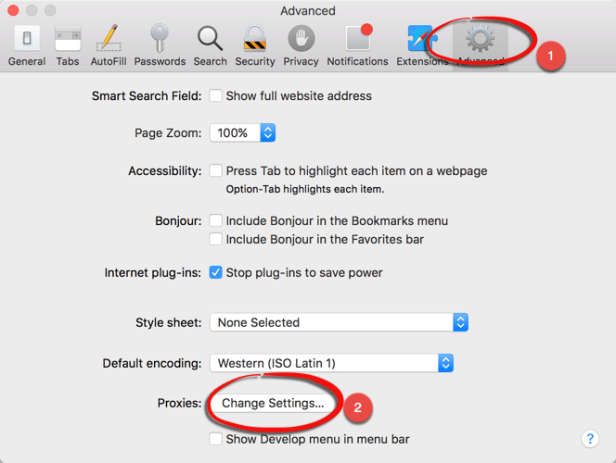
- Network pop-up is opened. Now follow the next steps in Chrome section, it’s the same
Step 6: Now you can start to record your navigation
- Go to http://jmeter.apache.org/
- Go to Documentation > Get Started
- Go to Documentation > User Manual
- Go to Documentation > Component Reference
- Go to Documentation > Functions Reference
- Go to Download > Download Releases
And this is the result, all recorded requests will be stored under Recording Controller
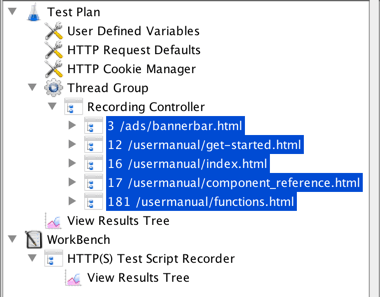
If you’re wondering why the last request Download > Download Releases didn’t appear here, then the answer is: it’s not the request end with html as the URL Patterns to Include which I defined in step 3 above.
Checking the View Result Tree of HTTP(S) Test Script Recorder, it shows all requests were made during the recording, but only needed requests were being saved to Recording Controller.
Please try this by yourself, the result might difference a bit, but you will improve it after few times.
Recording HTTPS Request
I hope it’s easy for you to record your very first script. But if you’re trying to record an HTTPS website, you might face the error like below:


When you see this error, it means you need to install the certificate before recording an HTTPS website.
Very easy, please do the following step to pass this issue
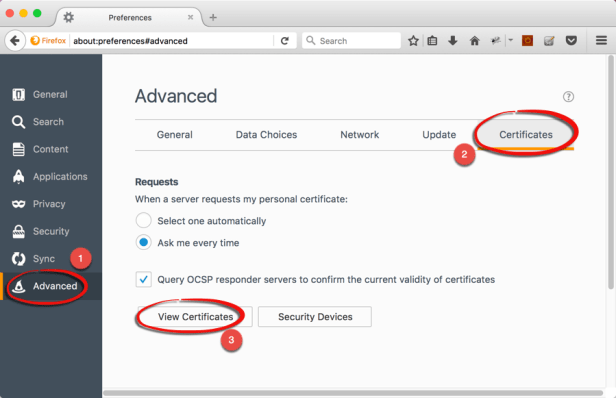
Firefox:
- Open Firefox
- Click Menu > Preference

- Go to tab Advanced > tab Certificates > View Certificates
- The pop-up is opened, go to Authorities tab > Import
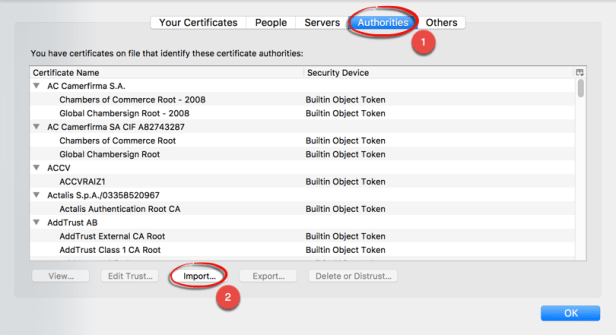
- Browse to the file ApacheJMeterTemporaryRootCA.crt under /${JMETER_HOME}/bin folder
Note: This file is only generated after you click Start button in HTTP(S) Test Script Recorder, refer Step 4 above.

- Select option: Trust this CA to identify websites

- It will auto go back the Authorities pop-up and show the recent added Certificate of JMeter (check the image below), click OK to finish.

Chrome (on MAC):
- Open Chrome
- Open the Menu by clicking the three dot button and select Settings.
 or just input the following text:
 chrome://settingsin Chrome’s address bar and press enter

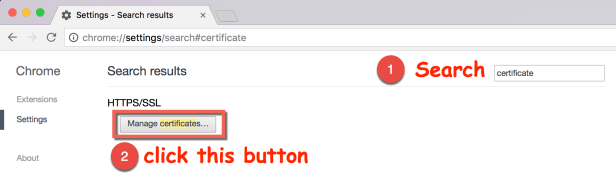
- Input “certificate” into the Search Settings field, then search. And click Manage certificates… button under HTTPS/SSL section
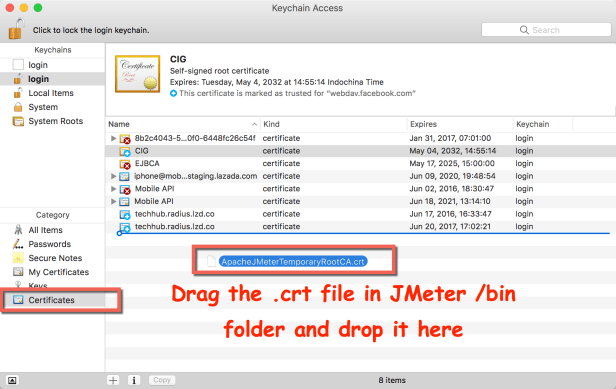
- It opens the Keychain Access popup, focus to the Category Certificates, drag and drop the
ApacheJMeterTemporaryRootCA.crtfile in JMeter /bin folder, and drop it into this.
Note: This file is only generated after you click Start button in HTTP(S) Test Script Recorder, refer Step 4 above.
- After importing into the Certificates category, it will display as untrusted file
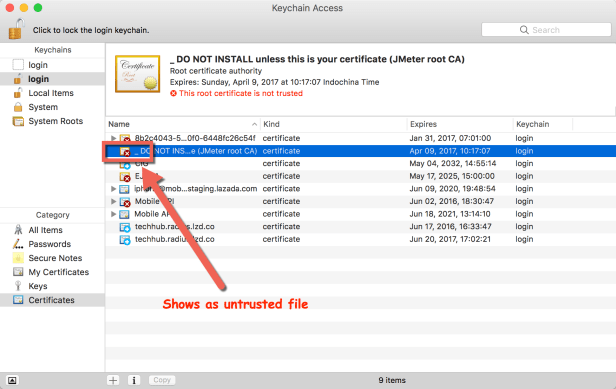
- Now we must change it to trusted by doing the following: Double Click on this file, and change the option When using this certificate from Use System Defaults to Always Trust.

- Close that pop-up, the user password might be required for this change. When it goes back to Keychain Access pop-up, check if the certificate is installed successfully and trusted now.
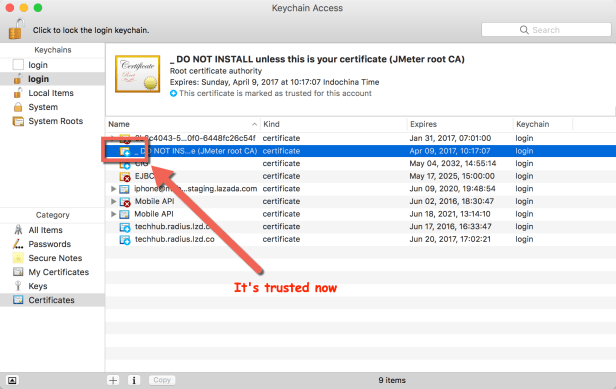
Now you can record the HTTPS website normally.

Hi sir,
I am new to Jmeter,
pls help me where to start and need some files…
LikeLiked by 1 person
Hi Sandeep,
Please go to this site: http://jmeter.apache.org/download_jmeter.cgi and download the latest release of JMeter, now it’s JMeter 3.1 and you should download the file apache-jmeter-3.1.zip
Unzip this file, and go to /bin folder, run jmeter.bat if you’re using Window, or run jmeter.sh on MAC and jmeter on Linux.
Make sure your machine has been installed Java 7 or higher.
If you face any issue while setup and install JMeter, just leave the other comment here, or you can join Skype group https://join.skype.com/P8chp8WIRwZM for more discuss.
Regards,
Vu
LikeLiked by 1 person
Tks admin.!
But i cannot recording , i think has somthing wrong ,i seen “HTTP request default” has not serverName Port Number . Can u checking again ? i am newbie , pls help …
LikeLike
Hello Sóc Nhím,
I just saw your comment, in this post, I remember I didn’t mention about the “HTTP request default”, where did you see it? If you’re still facing this issue, please directly contact me via Skype: harano1109
I will help you more detail.
Thanks.
LikeLike
Hi admin,
Secure Connection Failed with “Error code: SSL_ERROR_RX_RECORD_TOO_LONG ” when I try to record.
I am a newbie Jmeter. Could you help me to check with Firefox 63?
LikeLike
Really helpful. I struggled so much for this..
LikeLike