
Are you the new guy with JMeter? Don’t you have much experience with JMeter? Are you looking for a short tutorial to create a test plan? Do you find something basic to get familiar with JMeter? Etc.
If the answer is YES for one of the questions above or something like that, so please don’t worry anymore, because you’re good in researching and this is the right post for you. I’ll guide you how to create a very basic Web Test Plan in JMeter.
Firstly, let talk about the test scenario which I’ll go through in this post.
- Create Test Plan accesses to 3 HTTP Requests in jmetervn.wordpress.com
- 3 HTTP Requests are: Home page, Blog Post: Aggregate Report and Category: General
- Run the test with 5 users and Loop 2 times
Original image: click here
Step 1: Adding Thread Group
The first step you want to do with every JMeter Test Plan is to add a Thread Group element. The Thread Group tells JMeter the number of users you want to simulate, how often the users should send requests, and how many requests they should send.
Go ahead and add the ThreadGroup element by first selecting the Test Plan, clicking your right mouse button to get the Add menu, select Thread (Users) and then select Add → ThreadGroup.
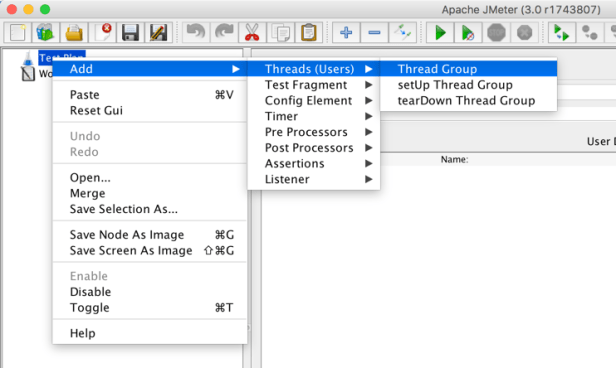
Or use the shortcut Ctrl + 0 , please refer post The shortcut in JMeter for more detail.
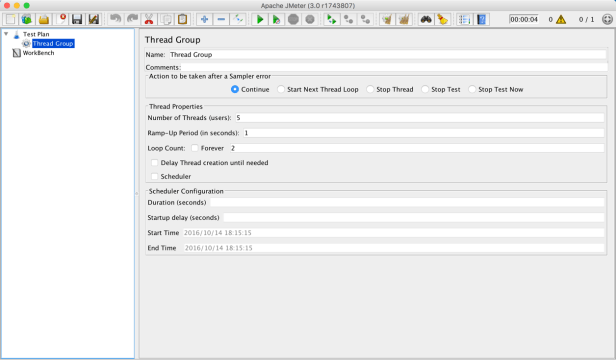
You should now see the Thread Group element under Test Plan. If you do not see the element, then “expand” the Test Plan tree by clicking on the Test Plan element.
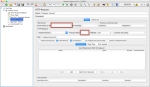
Next, you need to modify the default properties. Select the Thread Group element in the tree, if you have not already selected it. You should now see the Thread Group Control Panel in the right section of the JMeter window. Change Number of Threads (Users) to 5 and change Loop Count to 2. See the image below:
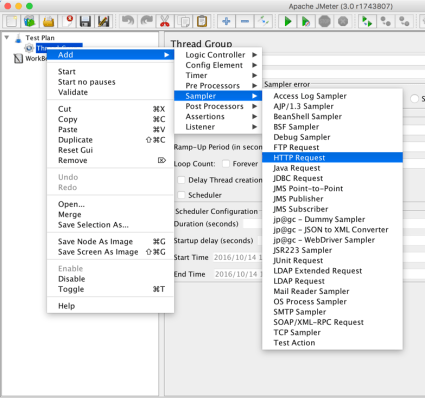
Step 2: Adding HTTP Requests
In our test plan, we need to create 3 HTTP Requests. The first one is the JMeterVN Home Page(https://jmetervn.wordpress.com/), the next one is the one of Blog Post: Aggregate Report(https://jmetervn.wordpress.com/2016/10/10/analyze-the-aggregate-report-in-jmeter/), and the last one is a category: General (https://jmetervn.wordpress.com/category/general/)
Start by adding the first HTTP Request to the Thread Group element (Add → Sampler → HTTP Request).
Then, select the HTTP Request element in the tree and edit the following properties:
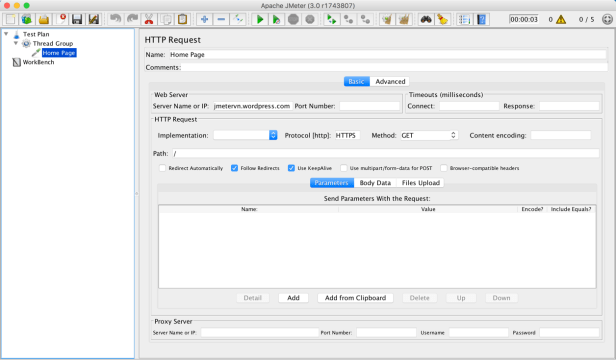
- Change the Name field to “Home Page“.
- Input jmetervn.wordpress.com into Server Name or IP.
- Input HTTPS into Protocol [http] field
- Set the Path field to “/“.
Do the same thing as above to add the second HTTP Request and edit the following properties:
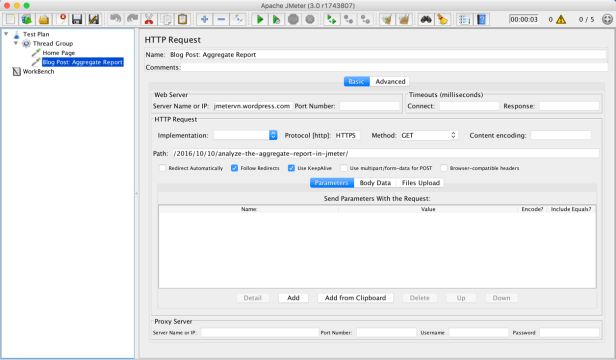
- Change the Name field to “Blog Post: Aggregate Report“.
- Input jmetervn.wordpress.com into Server Name or IP.
- Input HTTPS into Protocol [http] field.
- Set the Path field to “/2016/10/10/analyze-the-aggregate-report-in-jmeter/“.
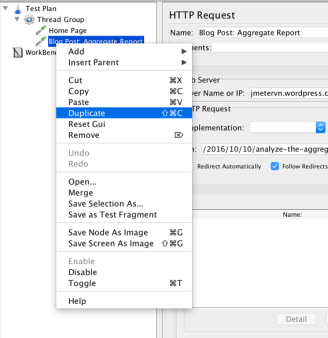
Now, let do it for the last one, this time, try to use the shortcut key Ctrl + Shift + C for Window or Command + Shift + C on Mac. The same way to do this, just right clicking on the element, then select Duplicate
Then edit the following properties:
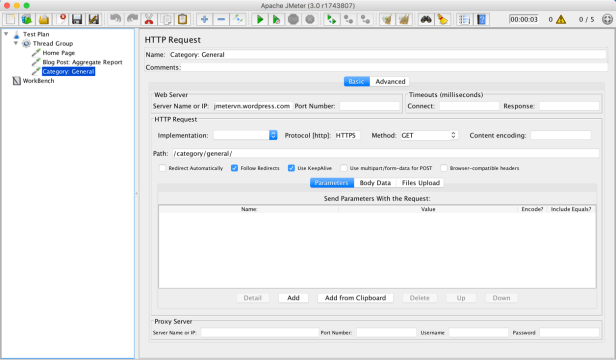
- Change the Name field to “Category: General“.
- Set the Path field to “/category/general/“.
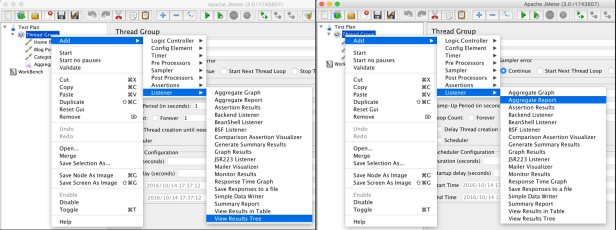
Step 3: Adding Listeners
The final element you need to add to your Test Plan is a Listener. This element is responsible for storing all of the results of your HTTP requests in a file and presenting a visual model of the data.
Select the Thread Group element and add a View Result Tree listener (Add → Listener → View Result Tree), and an Aggregate Report listener (Add → Listener → Aggregate Report)
Step 4: Running the Test
Now everything is all set, it’s time to run. Please don’t forget to save your test plan before running. To make sure everything will work well, we should use the validate feature first. This allows you to only start a selection of Thread Group, start them without applying Timers (thus gaining time) or start them using a new Validation mode. This validation mode allows you to start a Thread Group (without modifying it) with 1 thread, 1 iteration and without applying timers. Just right clicking the Thread Group element, and select Validate.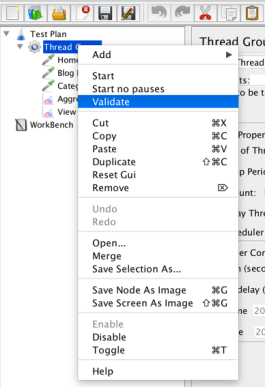
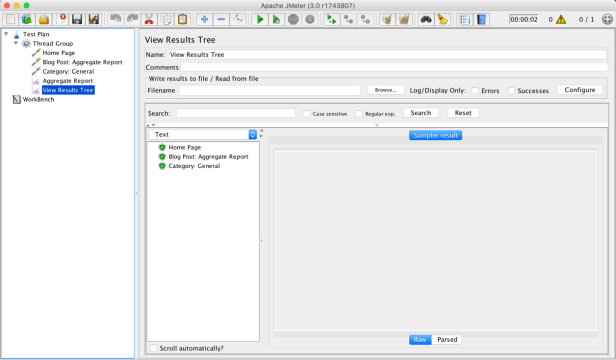
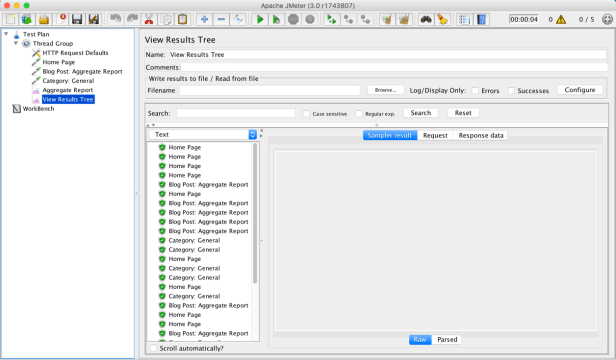
Look at the result in View Result Tree to see if everything is OK
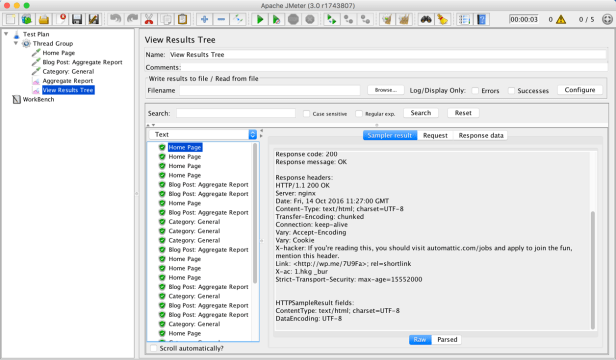
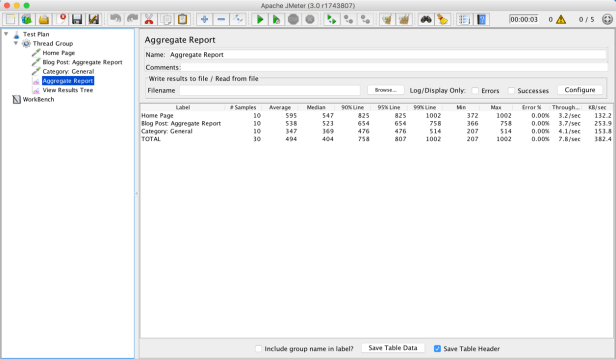
After that, let start the real test. Use the shortcut Ctrl + R, or click the Start button ![]() in the button toolbar to run the test. And select View Result Tree or Aggregate Report to see how it work.
in the button toolbar to run the test. And select View Result Tree or Aggregate Report to see how it work.
Step 5: Optimizing
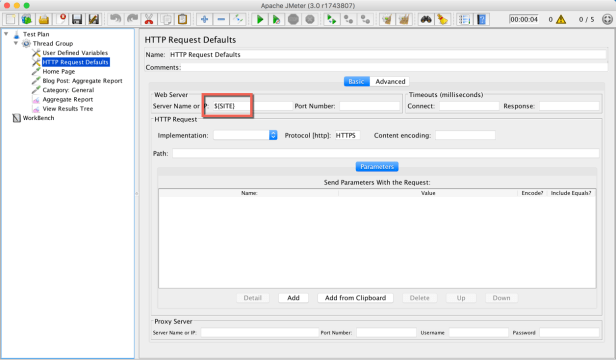
Hey, did you see any repeat work while you’re trying to create a test plan? Yes, that is the Server Name or IP and HTTP [protocol], or might be something more need to be repeated like that. For HTTP Request, we have a useful config, call HTTP Request Defaults.
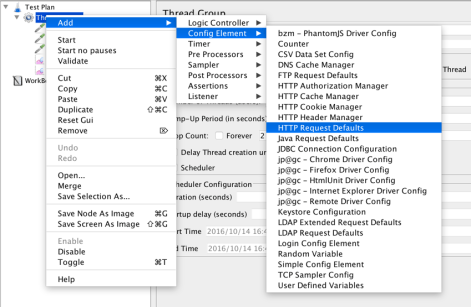
This element lets you set default values that your HTTP Request controllers use. For example, if you are creating a Test Plan with 25 HTTP Request controllers and all of the requests are being sent to the same server, you could add a single HTTP Request Defaults element with the “Server Name or IP” field filled in. Then, when you add the 25 HTTP Request controllers, leave the “Server Name or IP” field empty. The controllers will inherit this field value from the HTTP Request Defaults element.

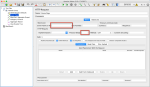
And this the result:
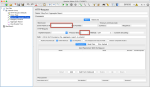
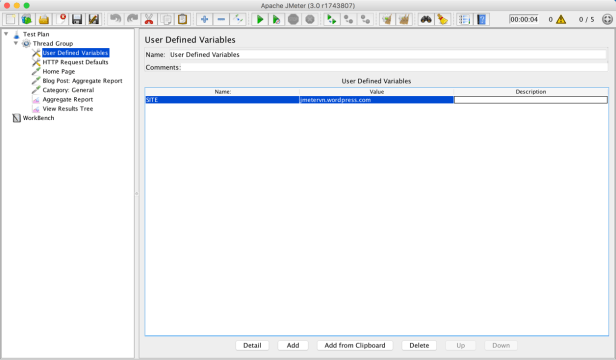
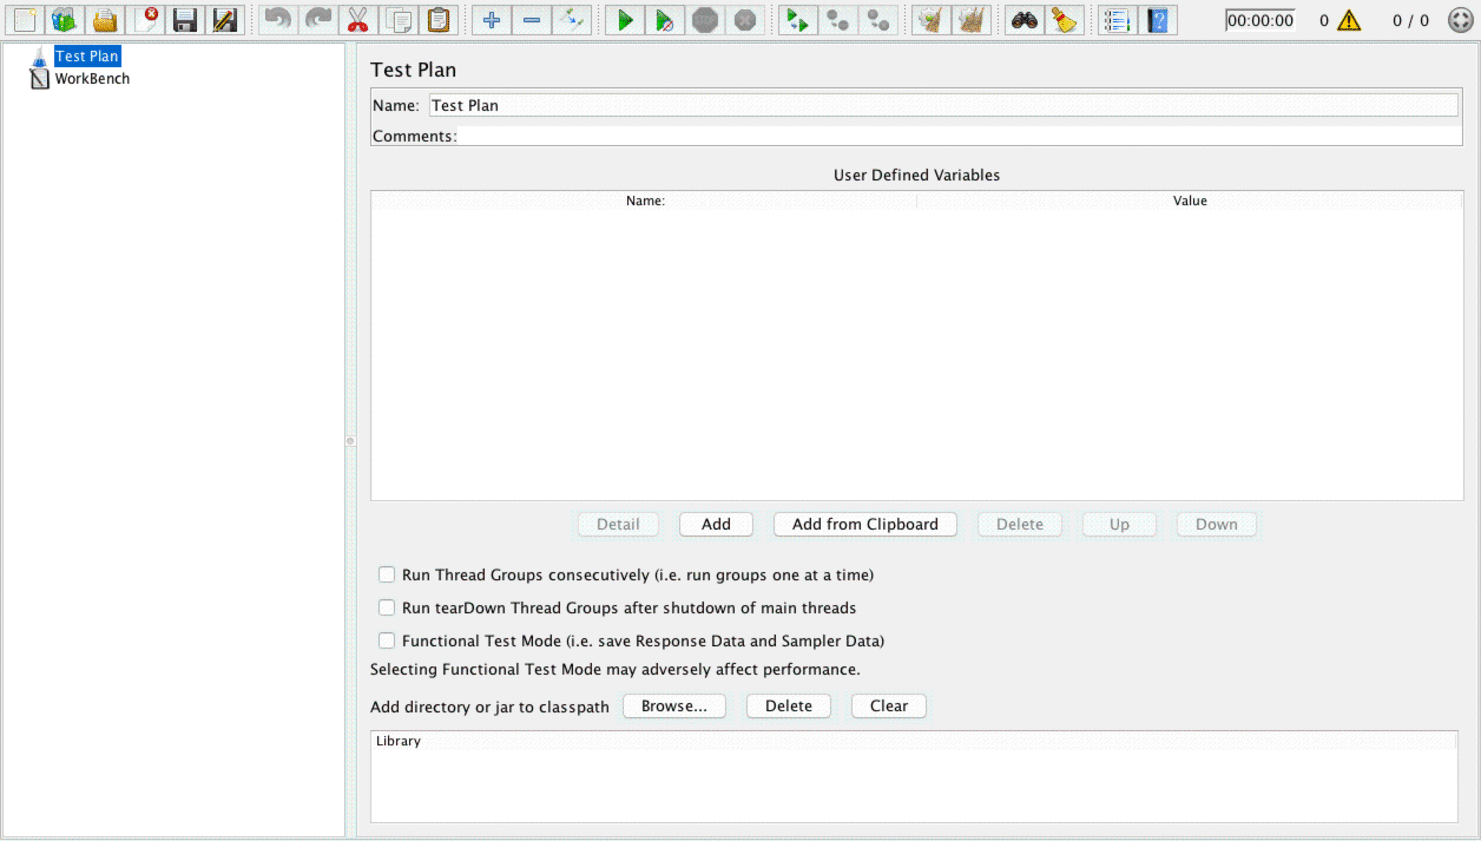
One more thing we can do, that parameterizes the Server Name or IP. Create a User Define Variables by selecting Thread Group element, click Add > Config Element > User Define Variables.
Define a variable named SITE (or any the name you want) with value is jmetervn.wordpress.com, then call that variable in HTTP Request Defaults by syntax ${SITE}
And, I don’t have any more to show in this post, that’s all you should know to create a basic Web Test Plan in JMeter. Please run the last one by yourself and enjoy your work.

Thanks, very useful 🙂
LikeLiked by 1 person
This is a great example for newbie like me. Thank you so much!
LikeLike
Thank you so much!
LikeLike
thanks for your comment!
LikeLike