
One of difficulty in Performance Testing is how to read and understanding the report. How to give the accurate conclude with some statistics from the report? In JMeter, we have many kinds of the report, such as the graph, or table with statistics. In this article, I will show you the detail of each data of Aggregate Report in JMeter. In additional, base on the report, we will have the quick analysis the status of your system under tested.
1. Statistics
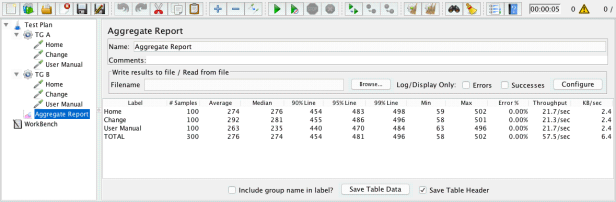
In the feature image above, you can see the Aggregate Report has 12 headers in its table. Let see what do they mean and how to calculate these data?
• Label: The label/name of the samples.
By default, all samples which have the same label/name (duplicated) will be displayed by only one row in the report. So please be careful with the samples under one thread group.
If “Include group name in the label?” is selected, then the name of the thread group is added as a prefix. This allows identical labels from different thread groups to be collated separately if required.

• # Samples: The total number of samples executed. The formula:
# Samples = Number of Threads (users) * Loop Count
Example 1: Thread Group has configuration
– Number of Threads (users): 10
– Loop Count: 3
So, an HTTP Request under this thread group will run 10 x 3 = 30 (times)
—> # Samples: 30
However, the formula above will be adjusted a bit in some cases: HTTP Request is under Logic Controller, such as Loop Controller, Once Only Controller, While Controller, etc.
Example 2: Let continue with example 1 above, but this time the HTTP Request is also under another Loop Controller, with Loop Count is 2. So it will run: 10 x 3 x 2 = 60 (times).
—> # Samples: 60
• Average(millisecond): The average response time of a set of results.
Response time is counted from the request has sent, until the last byte of that request has received from the server. So it includes the time to handle the request before sending (Pre-Processor), or the time to extract/handle data after receiving (Post-Processor).
Example 3: Request A run a total of 4 times with corresponding response time are 101ms, 106ms, 153ms and 128ms. So the average response time of Request A is 122ms.
• Min(millisecond): represent Minimum Response Time, it’s the shortest time for the samples with the same label.
In Example 3, the Minimum Response Time is 101ms.
• Max(millisecond): represent Maximum Response Time, it’s the longest time for the samples with the same label
In Example 3, the Maximum Response Time is 153ms.
• Percentiles(millisecond): A percentile (or a centile) is a measure used in statistics indicating the value below which a given percentage of observations in a group of observations fall. For example, the 20th percentile is the value (or score) below which 20% of the observations may be found.
- Median: is a number which divides the samples into two equal halves. Half of the samples are smaller than the median, and half are larger (Some samples may equal the median.) This is a standard statistical measure. See, for example, Median entry at Wikipedia. The Median is the same as the 50th Percentile.
In other words, the median is the time in the middle of a set of results. 50% of the samples took no more than this time; the remainder took at least as long. - 90% Line (90th Percentile) means 90% of the samples took NO MORE THAN this time. The 10% remaining samples took at least as long as this.
- 95% Line (95th Percentile) means 95% of the samples took NO MORE THAN this time. The 5% remaining samples took at least as long as this.
- 99% Line (99th Percentile) means 99% of the samples took NO MORE THAN this time. The 1% remaining samples took at least as long as this.
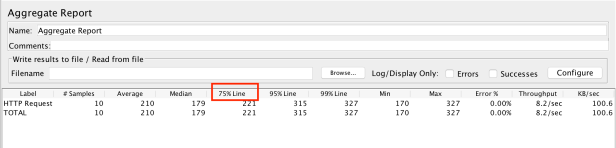
Starting with JMeter 2.12, you can configure the 3 percentile values you want to compute, this can be done by setting jmeter.properties file:
#---------------------------------------------------------------------------
# Aggregate Report and Aggregate Graph - configuration
#---------------------------------------------------------------------------
#
# Percentiles to display in reports
# Can be float value between 0 and 100
# First percentile to display, defaults to 90%
#aggregate_rpt_pct1=90
# Second percentile to display, defaults to 95%
#aggregate_rpt_pct2=95
# Second percentile to display, defaults to 99%
#aggregate_rpt_pct3=99
Uncomment the property aggregate_rpt_pct1, aggregate_rpt_pct2 or aggregate_rpt_pct3 with your expected percentile. I changed the first property to 75th percentile, close the file, restart JMeter and see how it work:
• Error %: Percent of requests with errors. Eg: the test runs Request A 100 times and got 15% Error, means the Request A has 15 times of error (100 * 15%).
• Throughput: is calculated as requests/unit of time. The time is calculated from the start of the first sample to the end of the last sample. This includes any intervals between samples, as it is supposed to represent the load on the server. The formula is:
Throughput = (number of requests) / (total time) * conversion
Where:
number of requests = number of executed requests
total time = (lastSampleStartTime + lastSampleLoadTime – firstSampleStartTime)
conversion : the unit of conversion value, example 1000 will convert the value to the second, 1000*60 will convert the value to the minute, etc.
Example 4: I will run this test with 5 threads and loop count 2. Refer result below:

I used View Results in Table to collect the Start Time, Response Time in an easiest way.
firstSampleStartTime: 17:24:55.911 (1476095095911 in ms)
lastSampleStartTime: 17:24:56.838 (1476095096838 in ms)
lastSampleLoadTime: 155ms
total time = (1476095096838 + 155 – 1476095095911) = 1082
number of requests = 10
Throughput = 10 / 1082 * 1000 ≈ 9.2/sec
Let check with the Aggregate Report:

And it can prove that the fomula works well. Let check it by yourself.
Note: The time unit is chosen so that the displayed rate is at least 1.0. When the throughput is saved to a CSV file, it is expressed in requests/second, i.e. 30.0 requests/minute is saved as 0.5.
• KB/sec: The throughput measured in Kilobytes per second. The formula is:
Throughput KB/sec = (Throughput * Average Bytes) / 1024
Where Average Bytes is the average size of the sample response in bytes. We can found this data on Summary Report.
• Total: The last row in the table is Total, only # Samples, the value in Total is equal to the sum of all values above. For all remaining value, it’s equal to the average of all values above.
2. Quick Analyze
Now at least we know the meaning of each data in the Aggregate Report. And next step, we’ll do a quick analyze with this report.
Response Time indicates the time which the server used to process the request, it is as low as possible. And throughput indicates how many requests will be processed at a time, so it’s as high as possible.
Let consider the comparison table below:
| Case | Response Time | Throughput | Conclude |
|---|---|---|---|
| 1 | Low | Low | This case has never happened. |
| 2 | Low | High | When the report show that the Response time is low and the Throughput is very high. That means the Server is working so well. The performance test is passed or you can consider to increase load and continue to find out the limitation of the Server |
| 3 | High | Low | When we find a scenario where the Response time for the request is high but the Throughput is much lower. This signifies that the Server is not capable enough to sustain/execute the request. Which ask for the tuning in the server side. |
| 4 | High | High | When the Response time is high but Throughput in comparison to the Response time is much higher. This implies that the request is taking more time because of fault in the application, may be the script is not good enough. We should not blame the server processing time for this. Now it’s time to consider other factors and tune them to make the application performance better. |

Amazing! Thank harano.
LikeLiked by 1 person
Very Helpful. Please post more and more details about jmeter in simple language. Thank you !!
LikeLiked by 1 person
Hi @Virendra
Thank you for your comment, I’ll try to post more and more useful topic about jmeter. And could you please let me know if my posts are simple enough? It will help me to improve in next posts.
Regards,
Vu Tran
LikeLiked by 1 person
Hi Vu Tran,
We are using JMeter for performance testing for quite some time. We run these tests in a batch at night and have a result report in the morning.
The problem is that after running the tests we get a lot of .jtl files that have to be opened in the Summary Report Listener of the JMeter GUI one by one, then saved to .csv (or just copy through aggregate report output )and then imported in MS Excel for further analyses. This is very time consuming and we would like to automated that step. Is it possible to convert the .jtl output to a summary report in .csv format without using the GUI? (Since in many cases we don’t have any GUI access that time we have to transfer that big jtl files to other machin and which is time very consuming )
Thanks !
LikeLike
Hello Bhushan,
It’s very easy. I thought your command line to run in Non-Gui mode like that:
jmeter -n -t your-test-plan.jmx -l result.jtl
Just change the extension .jtl to .csv, it looks like:
jmeter -n -t your-test-plan.jmx -l result.csv
Actually .jtl has the same format with csv, you can opened directly from Excel, or change extention of existed .jtl file to csv, or use command line as I suggested above is better.
Hope this help, please let me know if you have more question.
Vu Tran
LikeLike
Hi harano,
Can u please let me know how the values in 90% column is getting populated? is there any specific formula to get those value?
Thanks in advance.
LikeLike
Hi Harano,
if a request throws error, is its response time is counted for overall response time for calculating the 90% percentile or overlooked ?
LikeLike
Hi, I see average in aggregate report. but when I am trying to generate a csv file it does has average column. How can I get it in my CSV file
LikeLike
are kuch tho karo yar
LikeLike
Can you explain a bit more about the “conversion” part in the “Throughput” formula?
LikeLike