The dashboard generator is a modular extension of JMeter. Its default behavior is to read and process samples from CSV files to generate HTML files containing graph views. It can generate the report at end of a load test or on demand.
Please follow the steps below and you can see how to generate Dashboard Report in an easy way using non-gui mode. Also, I will show you some useful properties and the way to apply them for getting your expected report.
Note: This guide is applicable for JMeter 3.1 and above. It might not work for the previous version.
1. Requirement
1.1 The Test Plan
Yes, of course, you need a Test Plan to run the test. You can just refer the post here to create a Test Plan by yourself, or just download my sample Test Plan here.
1.2 JMeter configuration
To enable the generator to operate, the test result files must include certain required data. Check that your JMeter configuration in jmeter.properties file under JMETER_HOME/bin directory, it must follow these settings (these are the defaults):
jmeter.save.saveservice.bytes=true
# Only available with HttpClient4
#jmeter.save.saveservice.sent_bytes=true
jmeter.save.saveservice.label=true
jmeter.save.saveservice.latency=true
jmeter.save.saveservice.response_code=true
jmeter.save.saveservice.response_message=true
jmeter.save.saveservice.successful=true
jmeter.save.saveservice.thread_counts=true
jmeter.save.saveservice.thread_name=true
jmeter.save.saveservice.time=true
jmeter.save.saveservice.connect_time=true
jmeter.save.saveservice.assertion_results_failure_message=true
# the timestamp format must include the time and should include the date.
# For example the default, which is milliseconds since the epoch:
jmeter.save.saveservice.timestamp_format=ms
NOTE: these configurations are the defaults. In case you changed something before, then you need to make sure all of them are configured as above. Otherwise, you can ignore this step.
To ensure most accurate results, if you use a transaction controller, uncheck the box: Generate parent sample

2. Generation Reports
2.1 Generation from an existing sample CSV/JTL result file
Step 1: Run the test in non-GUI mode and save the report as csv or jtl format, using command in JMETER_HOME/bin directory
Windows:
jmeter -n -t [path to test JMX file] -l [path to result file]
Example:
jmeter -n -t C:\jmeter\gen-report.jmx -l C:\jmeter\gen-report.jtl
Unix (MacOS, Linux, etc.):
./jmeter.sh -n -t [path to test JMX file] -l [path to result file]
Example:
./jmeter.sh -n -t /Users/user/jmeter/gen-report.jmx -l /Users/user/jmeter/gen-report.jtl
No matter what the extension of result file is .csv or .jtl. Both of them should work.
Step 2: Use the following command to generate report from an existing sample CSV/JTL result file as above.
Windows:
jmeter -g [path to result file] -o [path to report output folder]
Example:
jmeter -g C:\jmeter\gen-report.jtl -o C:\jmeter\report
Unix (MacOS, Linux, etc.):
./jmeter.sh -g [path to result file] -o [path to report output folder]
Example:
./jmeter.sh -g /Users/user/jmeter/gen-report.jtl -o /Users/user/jmeter/report
After running this command, the report directory will be created, refer image below
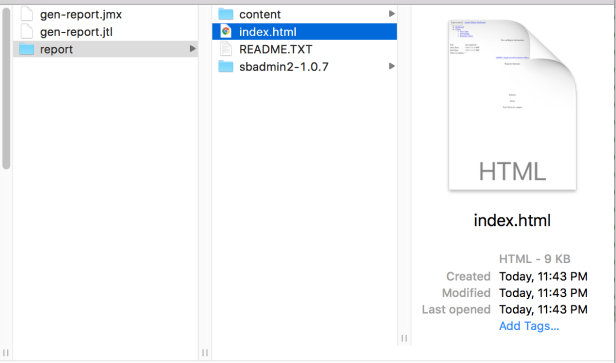
Click on the index.html file, it will open the dashboard report.
2.2 Generation after running test
Using the following command
Windows:
jmeter -n -t [path to test JMX file] -l [path to test result file] -e -o [Path to output folder]
Example:
jmeter -n -t C:\jmeter\gen-report.jmx -l C:\jmeter\gen-report-2.jtl -e -o C:\jmeter\report2
Unix (MacOS, Linux, etc.):
./jmeter.sh -n -t [path to test JMX file] -l [path to test result file] -e -o [Path to output folder]
Example:
./jmeter.sh -n -t /Users/user/jmeter/gen-report.jmx -l /Users/user/jmeter/gen-report-2.jtl -e -o /Users/user/jmeter/report2
Then you can check the report folder was generated successfully

Open the index.html file will show you the dashboard report
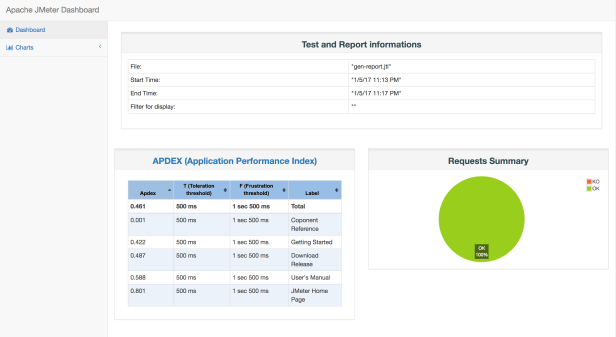
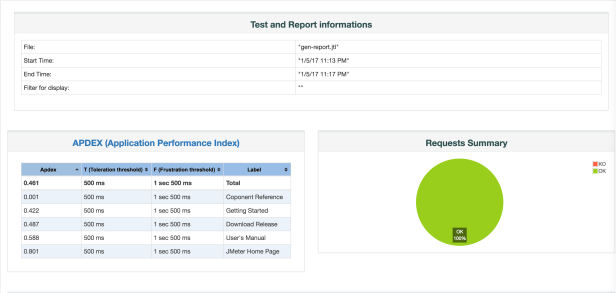
3. Report Overview
- APDEX (Application Performance Index) table that computes for every transaction the APDEX based on configurable values for tolerated and satisfied thresholds
- A request summary graph showing the Success and failed requests (Transaction Controller Sample Results are not taken into account) percentage:
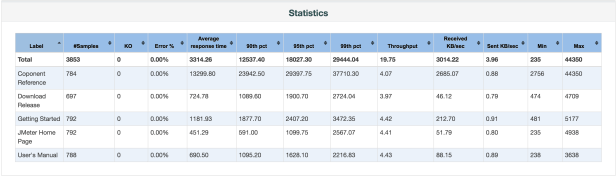
- A Statistics table (almost the same Aggregate Report) providing in one table a summary of all metrics per transaction including 3 configurable percentiles:
- An Error table providing a summary of all errors and their proportion in the total requests:
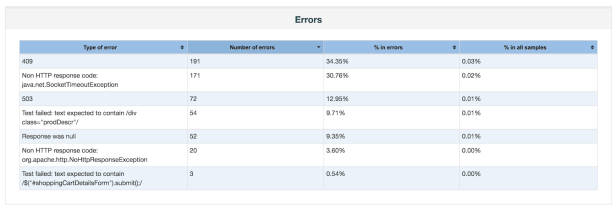
Illustration - A Top 5 Errors by Sampler table providing for every Sampler (excluding Transaction Controller by default) the top 5 Errors:
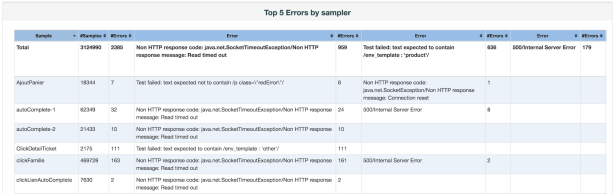
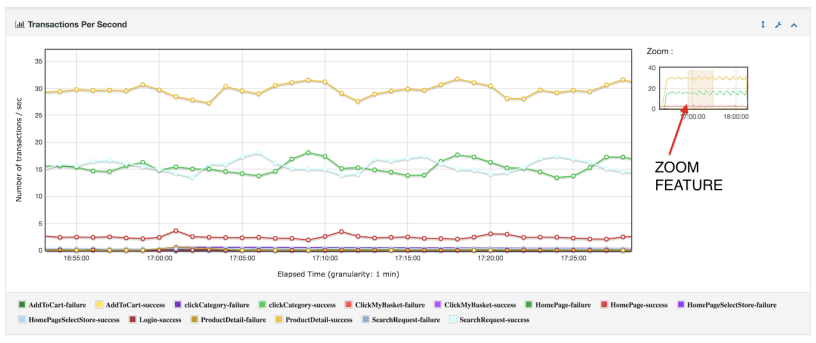
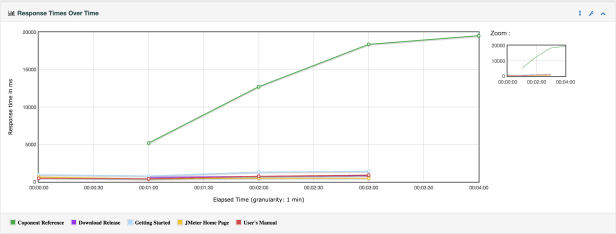
Illustration - Zoomable chart where you can check/uncheck every transaction to show/hide it for:
- Response times Over Time (Includes Transaction Controller Sample Results): This graph represents the average response time over time.
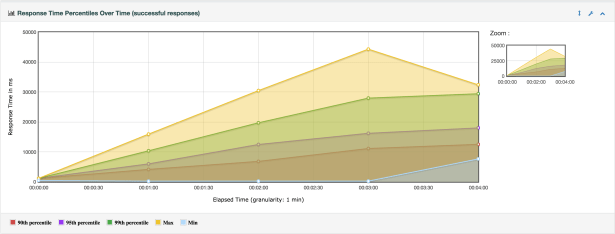
- Response times Percentiles Over Time (successful responses only): This graph shows Min/Max and 3 percentiles response time over time.
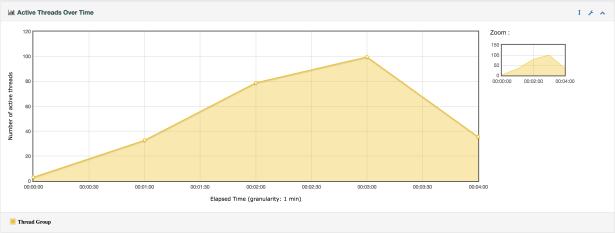
- Active Threads Over Time: This graph represents the number of active threads over time.
- Bytes throughput Over Time (Ignores Transaction Controller Sample Results): This graph represents the throughput of received and sent data over time.

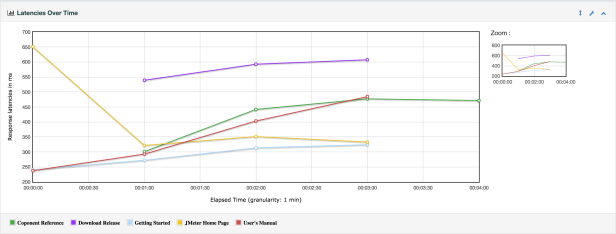
- Latencies Over Time (Includes Transaction Controller Sample Results): This graph represents the average latency time over time.
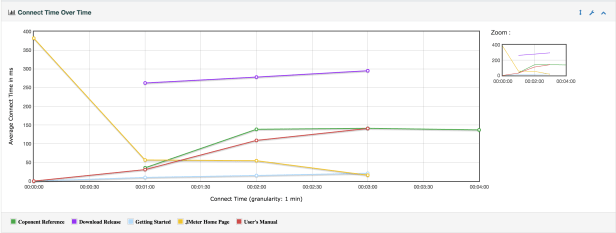
- Connect Time Over Time (Includes Transaction Controller Sample Results): This graph represents the connection time over time.
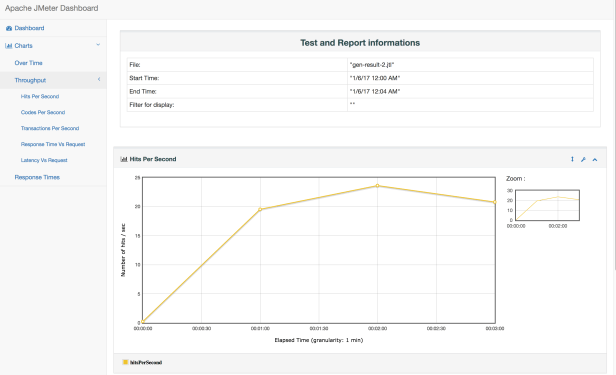
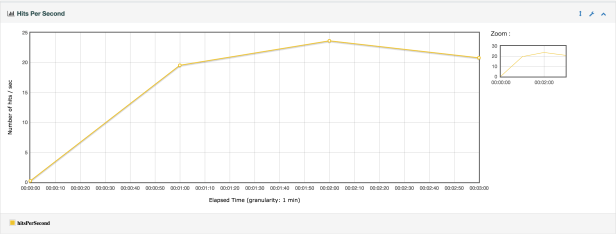
- Hits per second – aka Throughput (Ignores Transaction Controller Sample Results): This graph represents the rate of finished requests over time.
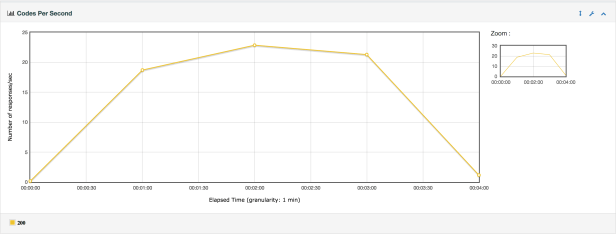
- Response codes per second (Ignores Transaction Controller Sample Results): This graph represents the rate of response codes over time.
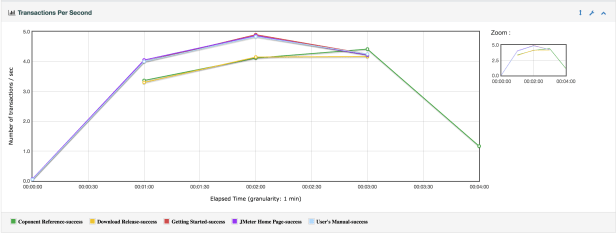
- Transactions per second (Includes Transaction Controller Sample Results): This graph represents the rate of transaction by sample name over time.
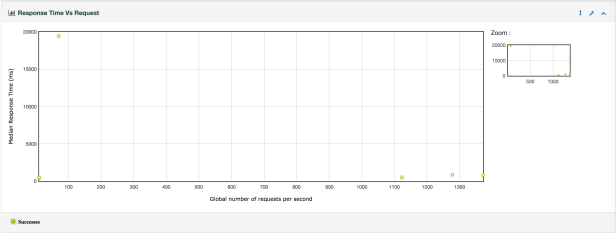
- Response Time vs Request per second (Ignores Transaction Controller Sample Results): This graph represents the median and average response time depending on the number of current requests.
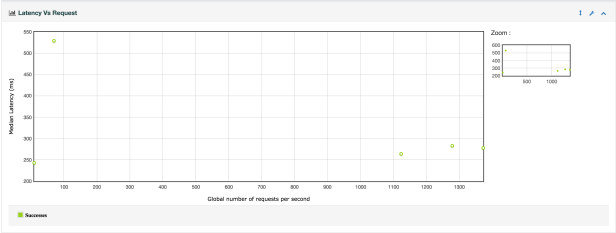
- Latency vs Request per second (Ignores Transaction Controller Sample Results): This graph represents the median and average latency time depending on the number of current requests.
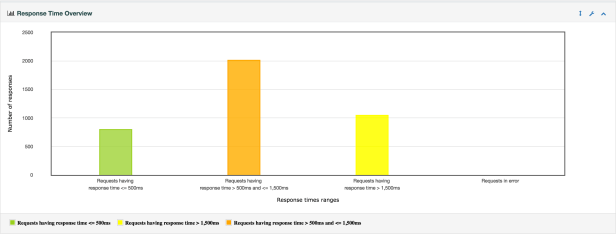
- Response time Overview (Excludes Transaction Controller Sample Results):
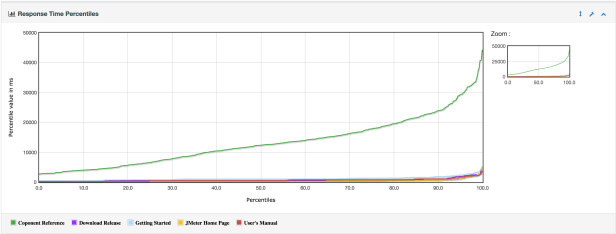
- Response times percentiles (Includes Transaction Controller Sample Results): This graph represents the percentiles of the elapsed time over time.
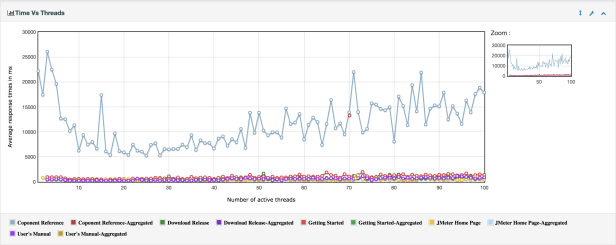
- Times vs Threads (Includes Transaction Controller Sample Results): This graph represents the average response time depending on the number of current active threads.
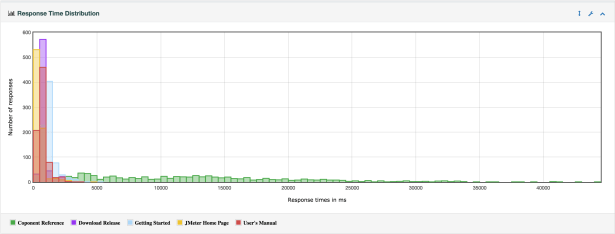
- Response Time Distribution (Includes Transaction Controller Sample Results): This graph represents the distribution of the samples depending on their elapsed time and name.
- Response times Over Time (Includes Transaction Controller Sample Results): This graph represents the average response time over time.
4. Custom Configuration
Dashboard generation uses JMeter properties to customize the report. Some properties are used for general settings and others are used for a particular graph configuration or exporter configuration. All report generator properties can be found in file reportgenerator.properties. To customize these properties, you should copy them in user.properties file and modify them.
Actually, in user.properties file, from version 3.1 of JMeter, it includes some basic and useful information for the report generator. So, to customize, just open user.properties file and change something on it.
4.1 Report Title
#jmeter.reportgenerator.report_title=Apache JMeter Dashboard
Uncomment by removing the sign # and configure this property to change the report title. Example:
jmeter.reportgenerator.report_title=JMeter VN Dashboard

4.2 Granularity
# jmeter.reportgenerator.overall_granularity=60000
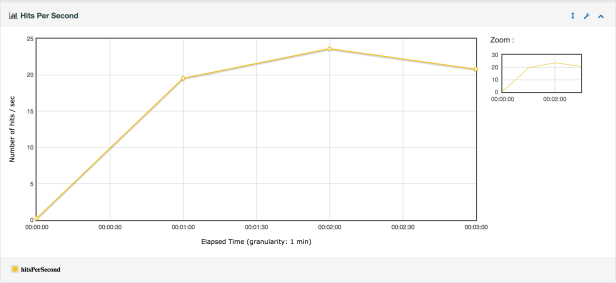
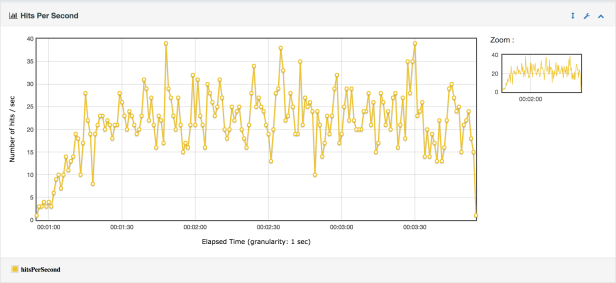
Change this parameter if you want to change the granularity of over time graphs. The granularity is the time between the two dots in the graphs will be displayed. By default, it’s 60000ms = 1min. So every 1 min, it will display 1 dot in the graph. If you change it to 1000 (1s), so every 1 second, the graph will draw a dot.
Enable this config by removing the sign # and set new value for granularity (millisecond)
jmeter.reportgenerator.overall_granularity=1000
Base on what is the duration test of your test, you can config corresponding the granularity. For example your test run in few hours, it makes sense to set granularity is 1min or 2mins, don’t set it to 1 second or less, or it will display a ton of dot in your graph which makes you crazy while looking at. And with the test runs only in few mins, then granularity = 1second or 100ms is the best in this case.
Refer these image below to see the difference between granularity 1min and 1second
4.3 Filtered
You can custom, config and generate the report with the requests which you want, using regular expression. For example, my test above has 5 requests, but I just want to generate the report with only 3 requests: JMeter Home Page, Coponent Reference and Download Release.
So I will uncomment the property and change the regular expression like below:
jmeter.reportgenerator.exporter.html.series_filter=((^JMeter)|(^Coponent)|(^Download))(-success|-failure)?
The regular expression above mean
(^JMeter) : request start with JMeter
(^Coponent): request start with Coponent
(^Download): request start with Download
| : or
Note that the end of the pattern should always include (-success|-failure)?
Save config, run the command to generate report again, please see what we have
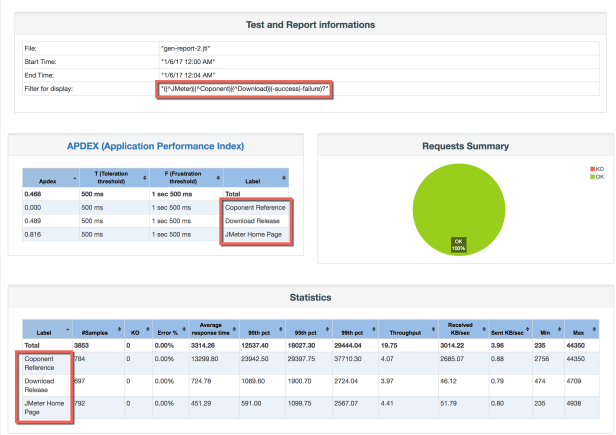
You can see, instead of 5 requests, it shows only 3 requests which I define in the property of user.properties file above.

But my question remains there.
How can I auto capture the My “Test Plan” title or name of my test in HTML Report?
LikeLike